Our World in Data @OurWorldInData
Our World in Data is a free, nonprofit website with a mission to increase understanding of the world’s largest problems and drive informed action to solve them. ourworldindata.org Oxford, England Joined April 2015-
Tweets3K
-
Followers306K
-
Following21
-
Likes471
Read more in our article, where we describe how death rates change with age and explain why that is: ourworldindata.org/how-do-the-ris…
The day a child is born is the most dangerous day of life. After birth, a child’s risk of dying declines rapidly across the first year of life. Risks continue to decline over the next few years, but suddenly rise again during adolescence. Finally, in adulthood, the chances of dying grow exponentially. If you plot the risk of dying against age, it looks like a J-shaped curve or a hook. You can see this in the chart. Across a historical timeframe, however, the whole curve has shifted downwards — the annual rates of death have declined across all age groups. You can see this by the different colored lines in the chart, which represent birth cohorts going back to 1800.

Explore the data and read more about maternal mortality trends and what has driven progress in other countries: ourworldindata.org/maternal-morta…
How likely is it that a 15-year-old girl will eventually die from a pregnancy-related cause? Researchers at the UN and the World Bank combined available birth and mortality data with statistical models to answer this question. Their estimates assume that the country’s fertility and mortality rates remain constant throughout the teenager’s lifetime (an important assumption we say more about below). The chart shows their results. In Chad, the Central African Republic, and Nigeria, the estimated lifetime risk is around 4%. This is dire: it means about 1 in 25 girls would eventually die from a pregnancy-related cause. Women in many other African countries also face substantial risks, and much of Sub-Saharan Africa has a rate above 1%. By comparison, estimates in most other regions are considerably lower, and across Europe the risk is below 0.1%. The very high risks for the countries on the left of the chart reflect two factors that compound: they have some of the highest maternal mortality rates in the world, and the average number of births per woman in these countries is also high. They face a high mortality risk per pregnancy, multiplied by five or six pregnancies over a lifetime. Maternal mortality rates per pregnancy and fertility rates are falling in these countries. Both of these declines would substantially reduce the lifetime risks. The results in the chart assume they stay at current levels, but that doesn’t have to be the case. (This Data Insight was written by @EOrtizOspina.)

Explore the updated data in our interactive charts: ourworldindata.org/search?dataset…
How much land is being burned by wildfires, and how is this changing over time? Wildfires occur all over the world, and can be hard to measure consistently. To track their numbers and size, we can use a single, global vantage point: satellites. That’s the approach the Global Wildfire Information System (GWIS) takes. They partner with NASA, whose satellites take images of the entire Earth's surface every 1–2 days, to estimate burned area for all countries and regions. GWIS provides both a long-term view, with annual data since 2002, and a near real-time view, with weekly data up to June 2026. Our colleague Veronika Samborska recently updated our charts with the latest annual and weekly data. GWIS also includes breakdowns by land cover type — forests, savannas, croplands, and more — so you can see both how much land is burning and what type. While satellites are a consistent way to track wildfires at the global level, they do have limitations. They tend to underestimate the true burned area because they often miss small fires and those obscured by cloud cover or tree canopy. They also don’t know why vegetation burned: the estimates capture all vegetation fires, so they can include some planned or agricultural burning alongside uncontrolled wildfires. Most cropland burning is too small-scale for these satellites to see, but some of it is captured, and is not what many people would think of as strictly “wildfires”.

Read more in the new article by @_HannahRitchie and Pablo Rosado: ourworldindata.org/how-much-are-p…
✍️ New article: “How much are people across the world paying for their carbon emissions?” Around 30% of the world’s CO₂ emissions are covered by a carbon price, through either a tax or a trading scheme. But to actually be effective, carbon prices need to be high enough to change consumption patterns, incentivize innovation, or make cleaner alternatives cheaper. When we look at the actual price people are paying for their emissions, we see that it’s often too small to make much difference. First, how much do carbon prices actually change what we pay for energy? At $5 per tonne of CO₂ — typical of many markets — the cost of a liter of petrol rises by less than 1%. That’s nothing compared to the regular ups and downs of oil prices. It’s only at around $100 per tonne, roughly the median estimate of the damage caused by a tonne of CO₂, that prices start to register: a 15% increase on petrol. Only a few countries charge more than $100, and they account for less than 0.5% of global emissions. Most of Europe sits in the $65–90 range, and most carbon markets charge less than $10. 71% of emissions have no price at all.

Read our colleague Max Roser’s article on the scale of the global smoking problem, and how we make progress against it: ourworldindata.org/smoking-big-pr…
Tobacco use in India has halved this century. At the turn of the millennium, one-in-five adults in India smoked tobacco, and almost half of all adults were using any form of tobacco, including products that are chewed or sniffed. But over the past two decades, rates of both have roughly halved. You can see this in the chart. Some countries have seen a decline in smoking among men, but a rise among women. This is not the case in India: tobacco use has fallen substantially for both sexes. This decline has huge implications. Each year, smoking causes almost one million Indians to die earlier than they otherwise would. Since smoking-related diseases can take decades to develop, this recent decline in smoking rates will result in fewer deaths in the future. Smokeless tobacco tends to have lower health risks because people are not inhaling smoke. But it still increases the risk of oral, throat, and esophageal cancers, gum disease, and other conditions. (This Data Insight was written by @_HannahRitchie.)

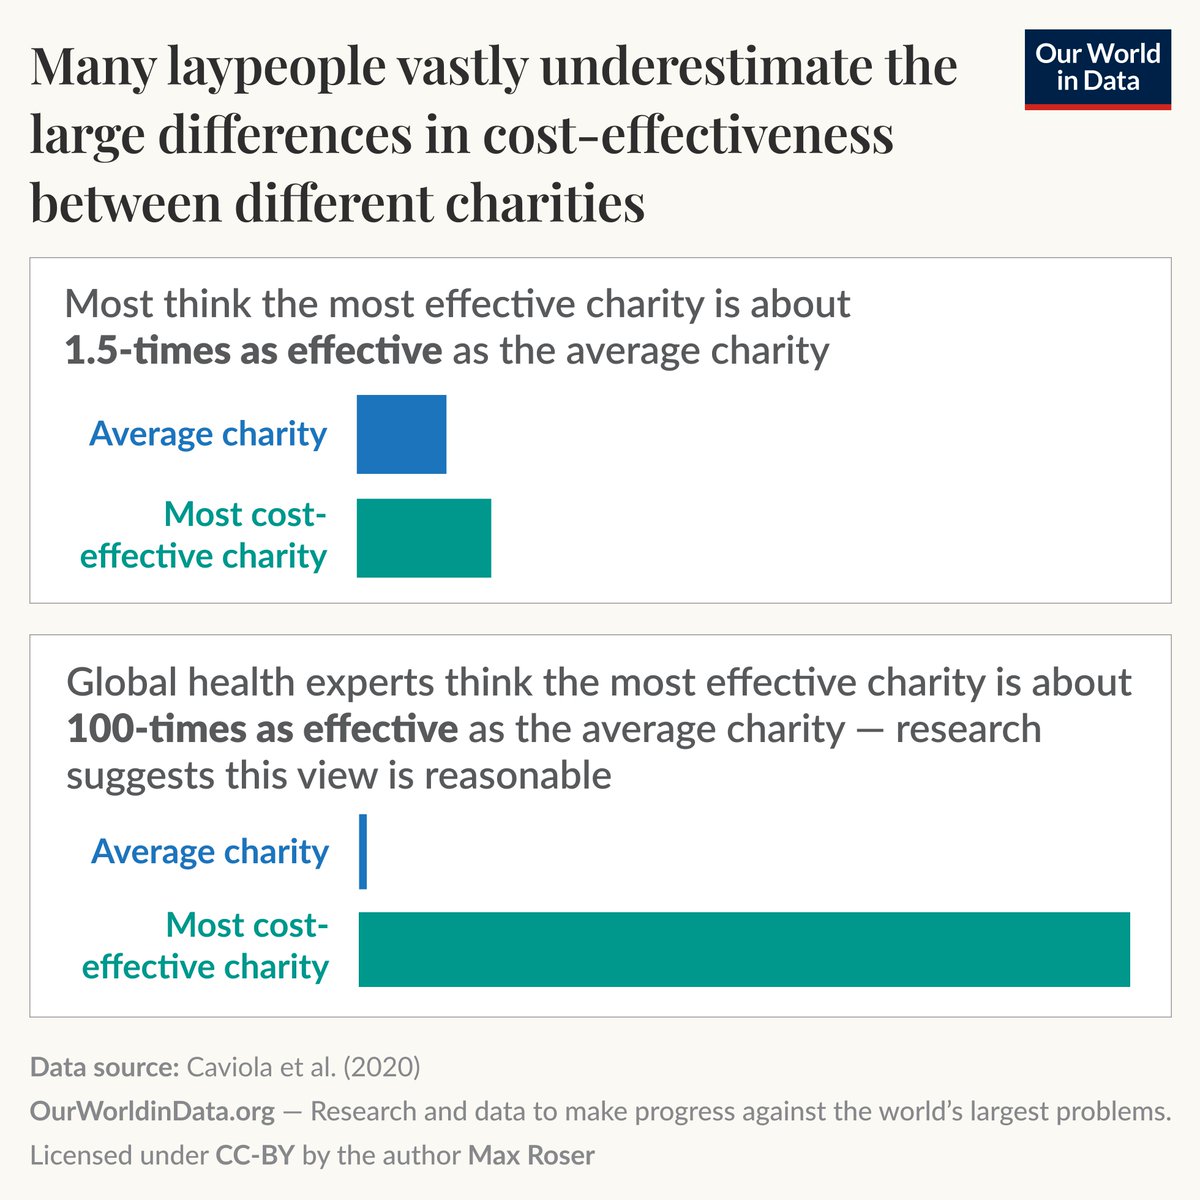
Read Max's article: ourworldindata.org/cost-effective…
Many of us can save a child's life, if we rely on the best data. Giving money to a charity is one of the best things you can do for others. Your donation can make a huge difference. But whether or not your donation makes a difference greatly depends on *where* you donate. If you give your money to the least cost-effective charities, it will not do much. If you give it to an exceptionally effective charity, the same amount of money can save someone’s life. We all feel that some charities are more effective than others, but we tend to underestimate just how large the differences are. Max Roser wrote an article that presents the data on these differences and makes the point that once you know them, the question of where to donate becomes morally crucial.
Read and subscribe here: ourworldindatabrief.substack.com/p/2026-06-19
The latest OWID Brief newsletter is out on Substack! It delivers all our recent work plus curated highlights from across Our World in Data, right to your inbox twice a month. This edition: Our new migration data tool, natural disasters, measles vaccines, fighting mosquitos with mosquitos, and much more. In each edition we also highlight recent Data Insights, our bite-sized insights on the world and how it’s changing. One of today's: What is the largest source of electricity in each country?

Subscribe to our Data Insights newsletter to receive our bite-sized insights on how the world is changing, right to your inbox every few days: ourworldindata.org/subscribe
Discover more writing and data on our page on light at night: ourworldindata.org/light-at-night
The price of lighting has dropped over 99.9% since 1700— In the last two centuries, the price of lighting has decreased drastically. You can see this in the chart, which plots historical data from Roger Fouquet. To allow for comparisons over time, the data is adjusted for inflation and expressed in prices for the year 2000. In the early 14th century, one million lumen-hours — a standard lighting measure — would have cost around £34,000 in 2000 prices. By 2023, this had fallen to £2.15, a 16,000-fold decline. Innovations in lighting appliances, fuels, infrastructures, and institutions during the 19th and 20th centuries made this progress possible. To put this in perspective, consider that a standard 100-watt incandescent light bulb today can emit about 1,600 lumens. Therefore, running one such bulb for 24 hours would produce about 40,000 lumen-hours. That means that 1 million lumen-hours today would require continuously keeping a standard 100-watt incandescent bulb on for about 26 days. Achieving the same amount of light with candles would require 120 candles burning at once for that entire period. Most people today take the ability to switch on a light at night for granted. But those who live or have lived without artificial light can appreciate how important it is. (This Data Insight was written by @EOrtizOspina and @parriagadap.)

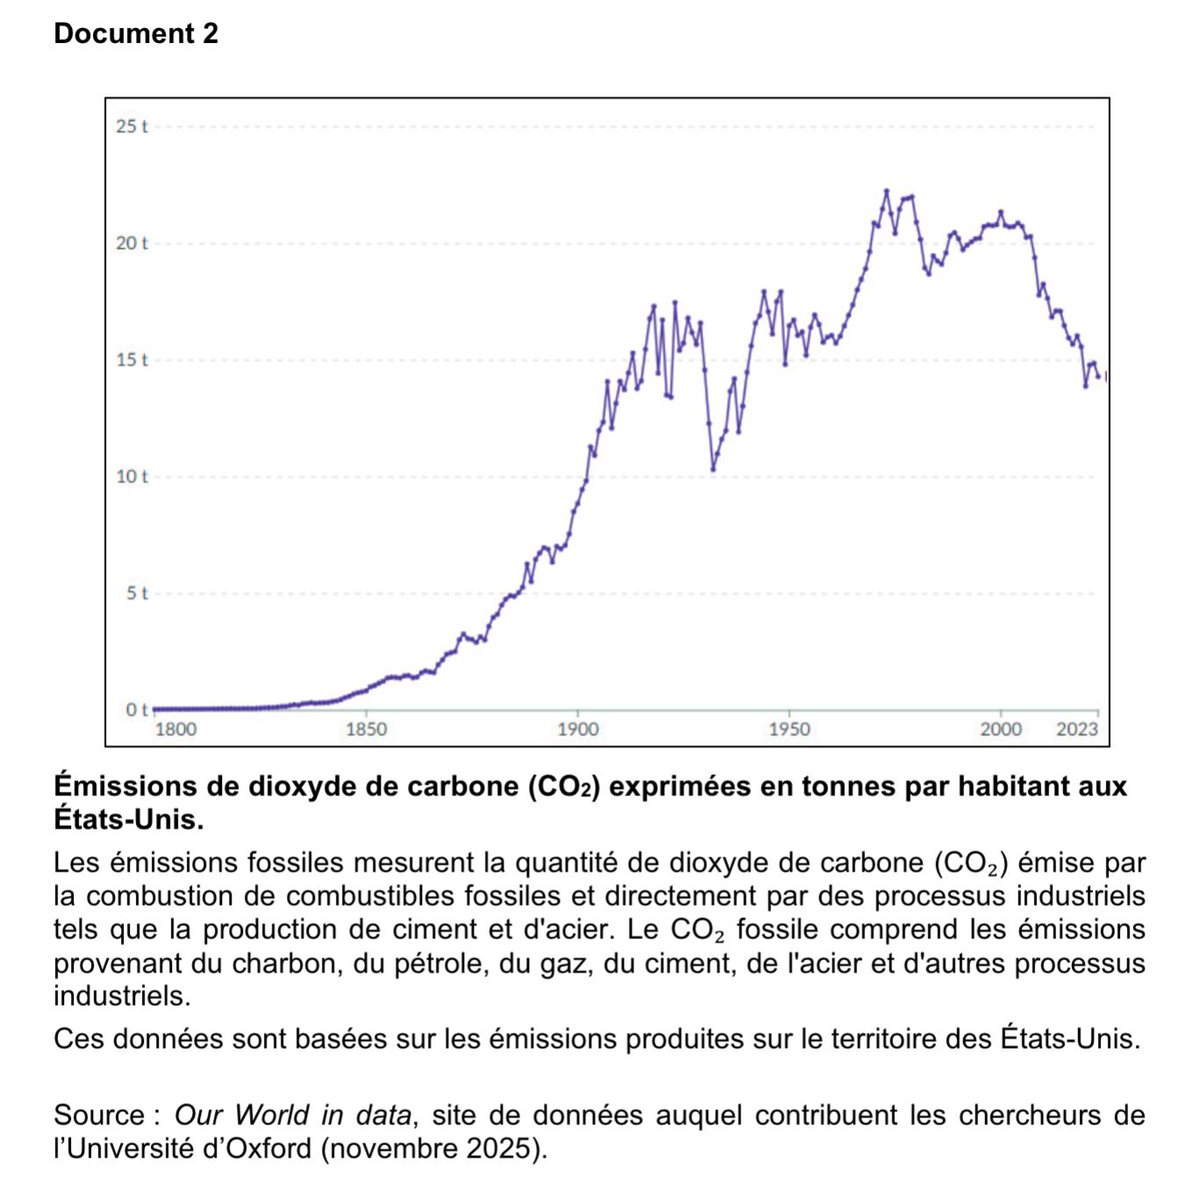
Learn more about using Our World in Data for teaching: ourworldindata.org/teaching
Our chart on CO₂ emissions per capita — relying on data from the Global Carbon Project — was part of the national baccalauréat exam in France yesterday! Tens of thousands of high school students had to analyze and discuss the data to write about the United States and environmental issues. This is just one example of how our work is used in teaching and learning around the world. We hope the exam went well for everyone!
Note: We originally posted this yesterday, but deleted it after noticing an error in the charts. While the breakdown of where immigrants came from was correct, the total number of immigrants shown for each country was incomplete — the UN source data includes an "Other countries" category that we hadn't added into those totals. We've now fixed this, and the corrected figures are shown here and in the interactive tool on our website. Apologies for the mistake!
Explore the data for your country: ourworldindata.org/where-do-migra…
In 2024, around 280 million people lived in a different country from the one in which they were born. That’s around 3.5% of the global population. Where were these international migrants born, and where did they move to? Our colleague Sophia Mersmann built a new interactive data visualization that lets you answer these questions — for any country you’re interested in. First, select a country. On the left-hand side of the visualization, you can see the total number of people living in that country who were born elsewhere, and where they were born. On the right-hand side, you can see the number of people born in that country who have moved away, and where they moved to.

Hannah Ritchie @_HannahRitchie
79K Followers 1K Following Deputy Editor @OurWorldinData / Researcher at @UniofOxford / Honorary Fellow at @EdinburghUni @EdCentreCC / Not the End of the World: https://t.co/FoINhggvoR
Max Roser @MaxCRoser
273K Followers 1K Following Data to understand global problems and research to make progress against them. Founder of @OurWorldInData / Professor at @UniofOxford
Human Progress @HumanProgress
177K Followers 772 Following A @CatoInstitute project. Subscribe to our newsletter: https://t.co/j30bRWWLoJ
Statista @StatistaCharts
145K Followers 1K Following We’re no longer active on this platform. Follow us on Instagram, LinkedIn and Facebook for the latest insights.
Stefan Schubert @StefanFSchubert
50K Followers 2K Following I run The Update newsletter. Book: https://t.co/I5zN3WGe0p
Jason Crawford @jasoncrawford
44K Followers 4K Following I write and speak about the history & philosophy of progress. Founder, @rootsofprogress. Host of the Progress Conference. Author, The Techno-Humanist Manifesto.
Edouard Mathieu @redouad
33K Followers 257 Following Head of Data & Research at @OurWorldinData • Open data and research on the world's largest problems • Currently off Twitter, please reach out via my website
Spencer Greenberg �... @SpencrGreenberg
35K Followers 7K Following A psychology researcher/mathematician/entrepreneur. I tweet about psychology, society, rationality, science, and philosophy. My book: https://t.co/qd3iRl7q1X
Rob Wiblin @robertwiblin
51K Followers 855 Following Host of the 80,000 Hours Podcast. Exploring the inviolate sphere of ideas one interview at a time: https://t.co/2YMw00bkIQ
Saloni @salonium
36K Followers 2K Following Co-founder & editor @WorksInProgMag. Writer, Scientific Discovery. Podcaster, Hard Drugs. Advisor, @coeff_giving. // Prev @OurWorldInData. 🏳️🌈
Asjad Naqvi @AsjadNaqvi
15K Followers 727 Following PhD Econ @NSSRNews 12. Habilitated. Stata stuff. Climate analytics, diagnostic tools, data science. @WIFOat + a few other affiliations.🌍
Amanda Askell @AmandaAskell
104K Followers 662 Following Philosopher & ethicist trying to make AI be good @AnthropicAI. Personal account. All opinions come from my training data.
Johannes Haushofer @jhaushofer
29K Followers 3K Following Economist at @CornellEcon and @CornellBPP. Founder @malengo @busaracenter. Also @SU_Economics and @eeg_mpi.
Habiba 🔸 @FreshMangoLassi
5K Followers 509 Following Co-founder @SpiroTB - TB screening and prevention charity focused on children https://t.co/sBf6ONGMSL 🔸 10% Pledge #103 with @Givingwhatwecan @habibabanu.bsky.soc
Abhijeet Singh @singhabhi
17K Followers 5K Following Dev economist at Stockholm @handels_sse and @JPAL. Past:@NuffieldCollege @EconUCL.Tweets on econ, edu, India, miscellanea.
Ilya Kashnitsky — b... @ikashnitsky
6K Followers 2K Following b s k y — @ikashnitsky.phd Demographer at Statistics Denmark/ PhD'20 U Groningen / EDSD 2017-18 / @datavizartskill #demography #openscience #rstats #dataviz
Cédric Scherer @CedScherer
24K Followers 2K Following Inactive account → find me on BlueSky and LinkedIn 🧙♂️✨📊 Independent #DataViz Consultant & Designer 👨🎓🌿🐗 PhD in Computational Ecology
Daniel Eth (yes, Eth ... @daniel_271828
11K Followers 995 Following Researching effects of automated AI R&D | pro-America, pro-tech, & pro-AI safety
Michael Plant @MichaelDPlant
3K Followers 567 Following Philosopher and global happiness researcher. Founder and Director, @HappierLivesIns. Postdoctoral Fellow @OxWellResearch @UniofOxford. All views yours, weirdly.
Nicholas D. Carter @NicholasDCarter
7K Followers 912 Following 🌳Director of Environmental Science | Game Changers Institute 📚 Research Fellow | Project Drawdown 🌱Co-founder https://t.co/mAadDmajoI
Ravindra kumar @Ravindr08519343
0 Followers 137 Following
yarPUNJABI @rahul_sharma_
183 Followers 421 Following Punjabi munda,selective in nature,practical minded,factory of productive tweets.
Maj. Ron Schaefer M.D... @Dr_da_Vinci
640 Followers 104 Following Polymath | MD Intensivist | NASA Astronaut Finalist | AI Innovator | Black Belt Champion | F4/F16 Flight Surgeon | Science Cover Research | Family Feud Champion

Akash Shrestha @aaktung
313 Followers 407 Following
VIKRAM KHILARE @VIKRAMSKHILARE
0 Followers 33 Following
Ze Guto Nalesso Camar... @ze_guto_nalesso
13 Followers 110 Following
Chirantan Deb @DebChirantan
148 Followers 4K Following "Football, bloody hell." ⚽ Day job: Web Analyst at iQuanti Rest of my life: Football, Movies, Games, Psychedelics. ❣️
LushNature @LushNature1
0 Followers 164 Following Don't settle for the default, but shape the future. Update fast and build. Agency under uncertainty. Reality can be inconvenient.
DoplerBicent @dani67166
2 Followers 150 Following
Cafésinpiquete @CesarGb75510
170 Followers 280 Following La Villa - Bolívar - CU Vida; Libertad; Propiedad.
Rocker80 @Rocker802
35 Followers 911 Following
nambiquara @nambiquara1
100 Followers 3K Following
Rodolfo Penha @rpenha
136 Followers 2K Following
Offlaner @Maf1909
13 Followers 435 Following Estou aqui apenas para ver notícias e compartilhar meu sentimentos e pensamentos ignore
Hermeson Barbosa @barbosah12
1 Followers 138 Following
Rose @Roseinthepark3
10 Followers 447 Following
Carmen LaDeLosGatos @Carmen_Hern
5K Followers 2K Following Statistical Analysis and Data Reconfiguration Experta en caídas y sangración. #ConLosGatosNo
Whatever @whatever_vidz
147 Followers 242 Following Infographics, Data Visualization, Statistics, Racing Charts and Graphs. YouTube / Tiktok: @whatever_productions Instagram: @whatever_vidz FB: @whatevervidz
Peter H. Kim @phtkim
107 Followers 788 Following Quantity has a quality all its own. Quitters never lose. Decrease risk, increase returns, and decrease fees, in that order.
Abe @fabmarini
17 Followers 110 Following
NickBelane11 @NickBelane111
10 Followers 251 Following

bozidar simunic @ImuniBoidar
0 Followers 97 Following
Emanuel R.G. @emanuelrgf_
4 Followers 32 Following BSc in Medical Physics (UNICAMP); MSc in Neuroscience (UNICAMP). Life is about tragedy, comedy and science
Stan Hatko @StanHatko
16 Followers 943 Following
Brandon Gregor @BrandonGregor
30 Followers 476 Following
The Protein Blob. @a_protein_blob
64 Followers 919 Following Just a blob of aminoacids floating around
Mac’s Money Machine @MacsMoneyParlay
42 Followers 147 Following Welcome to the greatest CFB gambling account for Friday games. Picks are released every Friday #WinnersOnly
Acácio Zaiden Neto @acaciozaiden
169 Followers 1K Following
Colin Lord @colinlord
990 Followers 3K Following Meteorologist turned software engineer • Married to @katyrae87 • Ironman • 18x Ironman 70.3 • 2023 IM70.3 World Championship • Born in Atlanta • Educated at FSU

meow meow @Hussien07854877
1 Followers 83 Following

Yago Sa @Yago_JSa
9 Followers 354 Following PhD Cell&Mol Biology / IPF, COPD, Asthma and Silicosis / Lung Organoids / Bioinformatic (bulk and scRNAseq) / Pharmacology and drug screening
OBS 👀 @OBS_2019_
24 Followers 898 Following
ritesh kumar @ritesh08dcm
1 Followers 83 Following
Bryan Gerstner @Azariahn1
1 Followers 13 Following


Cuts @lco_lucas
373 Followers 702 Following
Culprito @tucryp
10 Followers 136 Following
Jitender Chaturvedi @drjittu28
967 Followers 992 Following Additional Professor, Neurosurgery @aiimsrishi
Aumrit Narayan @Aumritnarayan
0 Followers 13 Following 🌍 Travel | 🎥 Vlogs | 💡 Motivation Turning journeys into stories ✨ Follow for real vibes 🚀
ᅠ @VINAYAKA_SUR
1 Followers 26 Following ࿀ ࿀ ⠀⃝ ⠀⃝ ⠀⃝⠀⃝ ࿀ ࿀⠀⃝ ࿀ ࿀ ⠀⃝ ࿀ ࿀ ⠀⃝ ࿀ ࿀ ࿀ ⠀⃝ ࿀࿀ ࿀ ⠀⃝ ࿀ ࿀ ࿀ ࿀ ⠀⃝ ࿀ ⠀⃝ ࿀⠀⃝ ࿀ ⠀⃝ ⠀⃝⠀⃝ ⠀⃝ ࿀

Ama Esenam @AmenorviEsenam
227 Followers 403 Following
Hannah Ritchie @_HannahRitchie
79K Followers 1K Following Deputy Editor @OurWorldinData / Researcher at @UniofOxford / Honorary Fellow at @EdinburghUni @EdCentreCC / Not the End of the World: https://t.co/FoINhggvoR
Max Roser @MaxCRoser
273K Followers 1K Following Data to understand global problems and research to make progress against them. Founder of @OurWorldInData / Professor at @UniofOxford
Edouard Mathieu @redouad
33K Followers 257 Following Head of Data & Research at @OurWorldinData • Open data and research on the world's largest problems • Currently off Twitter, please reach out via my website
Bertha Rohenkohl @BerthaRohenkohl
420 Followers 937 Following Not posting on this account anymore. You can find me on LinkedIn or Bluesky. Research and Data Economics Lead @OurWorldInData | Views my own.
Tuna @antea04
176 Followers 65 Following (she/her) data scientist @ owid, puzzle aficionada and generally curious about the world 🎲🍃👩🏻💻 - 📍 ldn
Angela Wenham @angelawenham
42 Followers 188 Following
Martin Račák @rakyi_
88 Followers 737 Following Trying to figure out what's going on, how things work, and to not get upset while programming. Engineer @OurWorldInData.
Antoinette Finnegan @AntoinetteF_18
22 Followers 54 Following


VRM @MuigaiValerie
50 Followers 40 Following
Daniel Bachler @DanyX23
877 Followers 2K Following Head of Engineering @OurWorldInData, author of https://t.co/8Dqm5584Xw. He/Him
Bastian Herre @bbherre
2K Followers 477 Following Researcher @OurWorldInData. I make research on democracy, human rights, armed conflict, and violence easier to access and understand. he/him
Fiona Spooner @f_spooner
1K Followers 959 Following Senior Data Scientist @OurWorldInData 🌈🌎🌍🌏 [email protected]
Lucas Rodés-Guirao @lucasrodesg
961 Followers 544 Following data at @OurWorldInData open source, open data, ai/ml he/him 🌱
Marcel Gerber @MarcelGerber9
450 Followers 1K Following computer science student @RWTH & developer for @ourworldindata. into charts and trains.
Matthieu Bergel @mlbrgl
203 Followers 0 Following Hi, I'm Matthieu. I leverage web technologies to do good - Currently working on @OurWorldInData's web platform and publishing tools.
Charlie Giattino @charliegiattino
936 Followers 283 Following Communications & Outreach Strategy Lead @OurWorldInData I care about understanding the world and making it better.
Bobbie Macdonald @bnjmacdonald
501 Followers 310 Following Stanford PhD. Currently working with the @OurWorldinData team on #COVID19.
Joe Hasell @JoeHasell
1K Followers 291 Following Head of Product @OurWorldInData | PhD candidate @DSPI_Oxford @INETOxford
Esteban Ortiz-Ospina @EOrtizOspina
9K Followers 949 Following - Executive Co-Director of @OurWorldInData - Honorary Researcher @OxMartinSchoolYou might like