Chart Seekers @chartseekers
"Helping All To Decode Charts & Master Market Structure" #Crypto #Commodity #Equity All my tweets for education & research purpose only Not a Finical Advice youtube.com/@chartseekers Global Joined August 2010-
Tweets3K
-
Followers2K
-
Following23
-
Likes3K
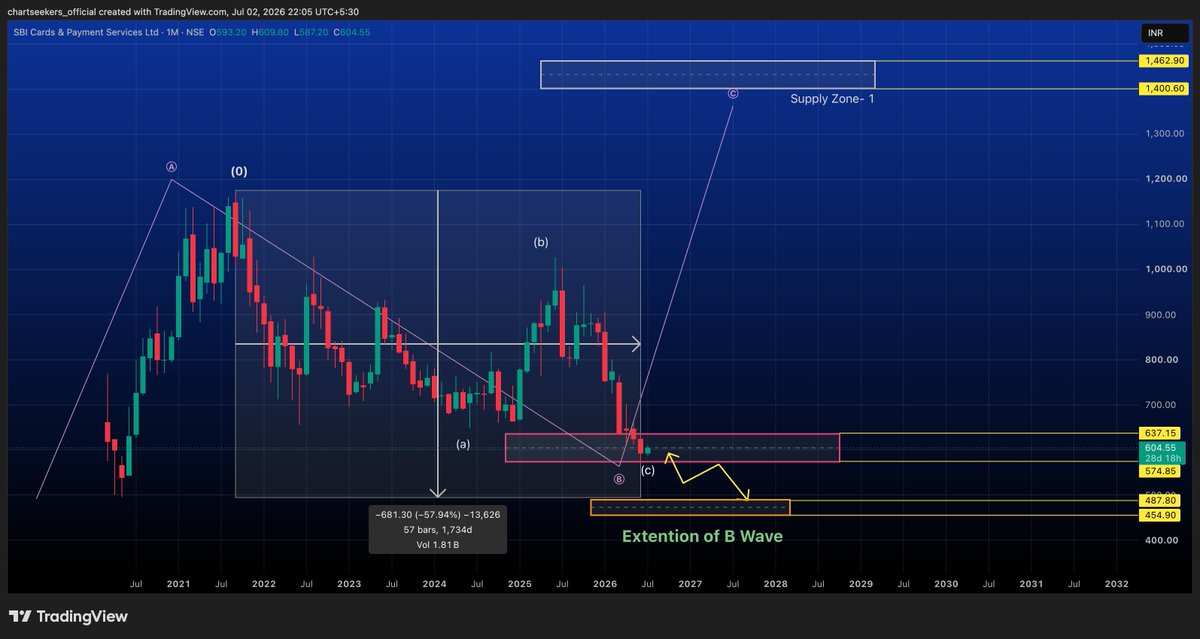
#SBICards – Monthly Technical View SBI Cards continues to trade within a larger corrective structure and is currently approaching the completion of the C-wave near a crucial demand zone around ₹575–₹637. Price action suggests that sellers remain in control, but the downside appears to be entering a region where a medium- to long-term reversal could begin. A failure to hold this support may lead to an extended B-wave correction toward the ₹455–₹488 zone before a sustainable bottom is formed. However, if buyers defend the current support and confirmation of accumulation emerges, the stock could initiate the next impulsive leg toward the ₹1,400–₹1,460 supply zone over the coming months. The current phase calls for patience rather than aggressive positioning. Traders should wait for price confirmation and improving momentum before considering bullish exposure. ⚠️ Disclaimer: This analysis is for educational purposes only and should not be considered financial advice. Please do your own research (DYOR) and consult a qualified financial advisor before making any investment decisions.
#NIFTY 50 Technical Outlook (Daily) Nifty continues to trade near a key resistance zone around 24,250 - - 24,750. The recent recovery remains constructive, but a decisive breakout and daily close above this area is needed to confirm further upside. If buyers sustain above resistance, the next target lies in the 25,220–25,360 supply zone. However, rejection from the current resistance could trigger a pullback toward the 23,400–23,100 support zone before the next directional move. Patience is key—watch for confirmation rather than anticipating the breakout

#Nifty 50 – Monthly Technical Analysis (July 2026) Nifty 50 ended June on a positive note after finding strong buying interest within the 21,700–22,600 monthly demand zone, reinforcing the long-term bullish structure. The recovery from this support suggests that institutional participants continue to accumulate on declines, keeping the broader trend intact. From an Elliott Wave perspective, the recent correction appears to have not completed Wave B, with the market now attempting to develop Wave C. The immediate challenge lies at the 26,227 supply zone, where previous rallies faced heavy selling pressure. A decisive monthly close above this resistance would confirm bullish momentum and increase the probability of an advance towards 28,098 and 28,588. On the downside, the monthly demand zone remains the key support. As long as Nifty holds above this region, the outlook continues to favour buyers. However, rejection from the supply zone could lead to short-term consolidation before the next directional move. Overall, July is expected to be a decisive month, with price action around 26,227 likely to determine the index's next major trend.

Bitcoin $BTC / USD) – Weekly Technical Analysis Bitcoin continues to trade under bearish pressure after failing to reclaim the key resistance region. The weekly structure remains corrective, with price currently testing a major demand zone around $58,000–$60,000, which has acted as an important support area in previous cycles. The 50-week moving average has turned into immediate resistance, while the 100-week moving average is also sloping downward, indicating that the broader trend remains weak. Bulls must reclaim and sustain a weekly close above $67,400 to invalidate the current bearish momentum and open the path toward the next resistance zone around $68,000–$72,000. As long as Bitcoin remains below this level, the probability of another leg lower cannot be ruled out. A decisive breakdown below the current support zone could trigger a move toward the next weekly demand area near $49,000–$52,000, where stronger buying interest may emerge. From an Elliott Wave perspective, the current price action suggests the corrective phase may not be complete, and confirmation will come only after price either reclaims the key resistance or loses the present support. Key Levels Resistance: $65,400, $68,000–$72,000 Support 1: $58,000–$60,000 Support 2: $49,000–$52,000 Outlook: Bearish below $67.4K. A weekly close above this level would improve the medium-term outlook, while failure to hold the current support zone increases the probability of a decline toward the next weekly demand area.

$NVDA Get your self ready for the crash in the NVIDIA

🚨 LIVE TONIGHT | X SPACE | 10:00 PM IST 🎙️ Join Link Below 👇👇 x.com/i/spaces/1qGvv… The crypto market is approaching a critical phase, and we'll break it down live using Wave Theory, market structure, and key technical levels. 📊 We'll discuss: • Bitcoin, Ethereum & major altcoins • Current market structure • High-probability support & resistance zones #Bitcoin #Crypto #Ethereum #Altcoins #Trading #TechnicalAnalysis #CryptoMarket #XSpaces #ChartSeekers

$xag $silver Silver (XAG/USD) – Monthly Technical Analysis Silver has delivered a strong impulsive rally, completing what appears to be a five-wave advance on the monthly timeframe. The recent vertical move reflects aggressive buying momentum, but price is now approaching a major long-term supply zone where historical selling pressure could emerge. Such parabolic advances are often followed by a period of consolidation or a corrective phase before the next sustainable trend develops. From a wave perspective, the current structure suggests that Wave (5) may be nearing completion. A pullback toward the $58–61 region would be technically healthy, allowing the market to unwind overbought conditions while testing previous breakout levels. Failure to hold this area could extend the correction toward the monthly demand zone around $47, which remains the key support for maintaining the long-term bullish structure. If buyers successfully defend the demand zone and accumulation resumes, Silver could spend several months trading within a broad range before attempting another breakout. A decisive close above the long-term supply zone would invalidate the corrective outlook and open the path toward the $68 region initially, with the possibility of an extended move toward $120+ over the longer term. Overall, patience is essential. Chasing price after a near-vertical rally carries elevated risk. The preferred strategy is to wait for confirmation of a corrective pullback into support before positioning for the next major leg higher.

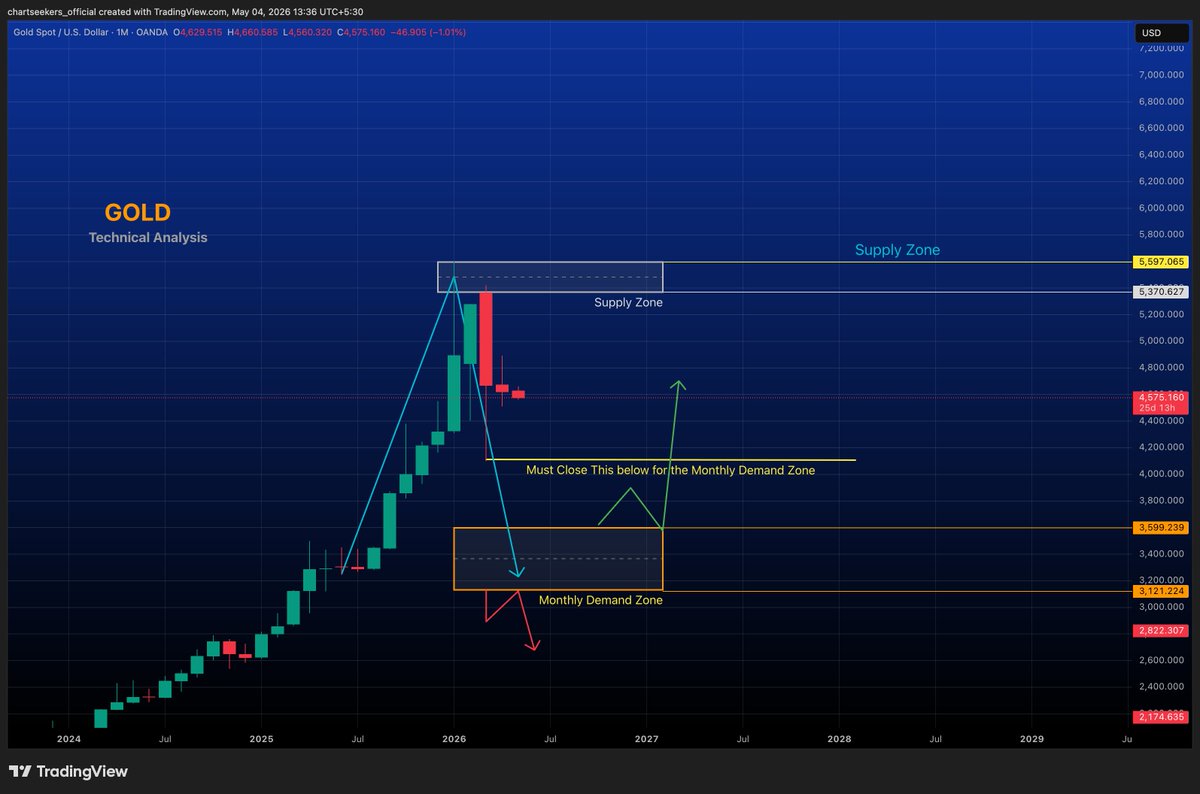
$xau $Gold (XAU/USD) – Monthly Technical Analysis Gold continues to trade within a long-term bullish structure despite showing signs of exhaustion after an aggressive vertical rally. The recent rejection from the marked monthly supply zone indicates that institutional selling pressure has emerged near the highs, resulting in consecutive bearish monthly candles. This suggests that momentum is cooling after a parabolic advance. From a price action perspective, the current correction appears healthy rather than a complete trend reversal. The inability to sustain above the supply zone has shifted the short-term bias toward further downside, with the next major area of interest located in the highlighted monthly demand zone around $3,200–$3,600. A decline into this region would represent a normal retracement within the broader uptrend and could attract long-term buyers if bullish confirmation develops. For now, patience remains the key. Rather than chasing price after an extended rally, traders should monitor the reaction around the monthly demand zone, where the next high-probability opportunity may emerge. Confirmation at support will be more important than attempting to predict the exact bottom.

$xau Get yourself ready for the correction phase in #gold. Make sure to note everything highlighted in yellow.
Thank you! I completely agree confirmation is always more important than anticipation. Markets reward patience and discipline, especially during periods like this. Using the holiday to refine your process and strengthen trading psychology is time well spent. Appreciate your support! If you enjoy Elliott Wave and long-term technical market analysis, feel free to follow my channel @chartseekers here and on X. I regularly share in-depth chart breakdowns and market insights. Looking forward to exchanging more ideas with you!
#NIFTY Technical View Nifty has moved straight into the resistance zone without offering a meaningful retest, reflecting strong buying momentum. If the index manages a decisive close above this resistance, it could open the door for the next major supply zone, with buyers likely to remain in control. The current structure remains bullish, but confirmation will only come with a sustained close above resistance. Until then, watch price action closely, as this level could still trigger profit booking or a short-term rejection.

#Nifty50 Technical Outlook for tomorrow Nifty continues to hold above the key demand zone, indicating that buyers remain active at lower levels. The recent pullback appears to be a potential retail trap, as selling pressure failed to push the index below Support-1. As long as

$eth ETH/USD Monthly Technical Analysis Ethereum continues to trade under heavy selling pressure on the monthly time frame after failing to sustain above the major resistance zone near $4,950. The rejection from this region strengthens the view that the larger corrective structure remains incomplete. Price is now approaching the Monthly Support-1 area around $1,750-$1,400, a zone that could determine the next major directional move. From an Elliott Wave perspective, the chart suggests the ongoing decline may represent the final stages of the corrective C-wave, with a possible extension where both the B and C waves terminate in the same accumulation zone between $1,000 and $600. If panic selling emerges into this support cluster, it could provide the final washout before a long-term reversal develops. As long as Ethereum remains below $2,500, the broader trend favors caution and rallies should be viewed as corrective rather than the start of a new bull cycle. A decisive monthly close below $1,750 would increase the probability of a deeper decline toward the projected support region. However, if buyers successfully defend the support zone and accumulation begins, Ethereum could initiate a new impulsive advance. A sustained breakout above $2,500 would be the first confirmation of renewed bullish momentum, opening the path toward $4,950 and potentially new all-time highs in the next major cycle. Traders should remain patient and wait for confirmation rather than anticipate the reversal prematurely.

$btc waiting for the support zone -2 for will see the reaction at that zone for further direction
$BTC Technical View 📉 Bitcoin has broken below its key 4-hour support zone near $63,000, weekly and daily still intact signaling increasing selling pressure. The rejection from higher levels, combined with weakening volume structure, suggests that panic selling could accelerate

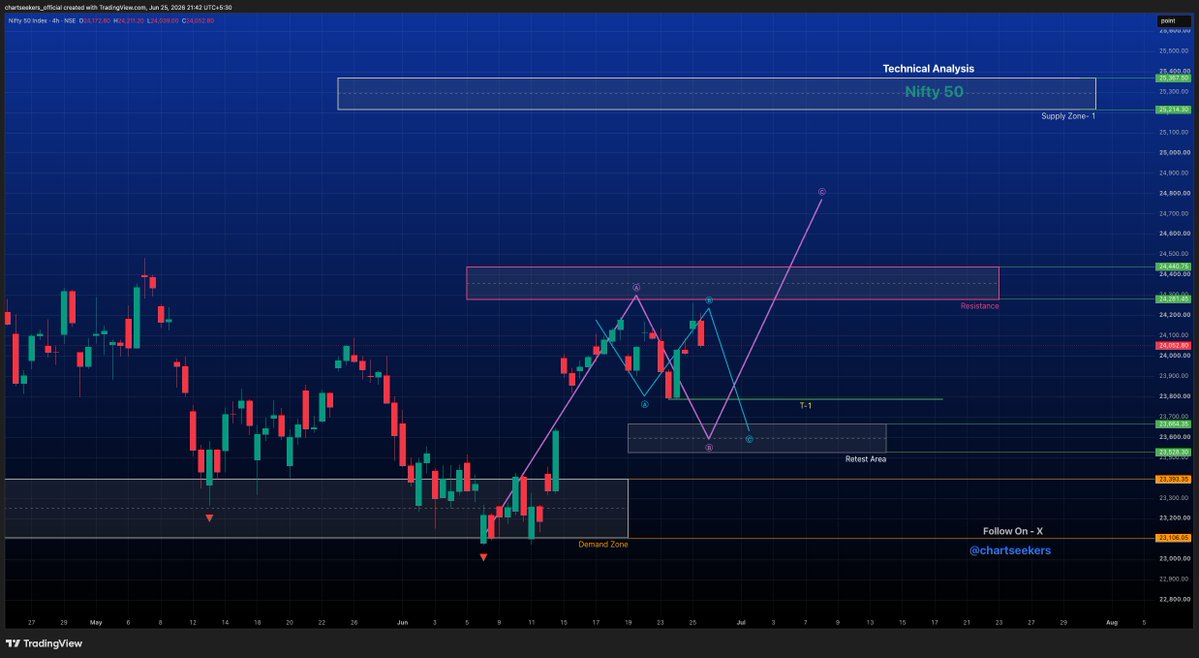
#Nifty 50 – Next Week Technical View Nifty 50 continues to trade above its recent swing low, keeping the short-term bullish structure intact. The index is approaching a key resistance zone around 24,280–24,400, where sellers may attempt to regain control. A decisive 4-hour close above this Resistance area could invalidate the immediate bearish scenario and open the path toward the next upside target near 25,200–25,400. On the downside, if resistance holds, a healthy pullback into the 23,550–23,650 retest zone remains possible before the next leg higher. As long as this support area is defended, the broader bullish outlook remains unchanged. Key Levels Resistance: 24,280–24,400 Retest Zone: 23,550–23,650 Bullish Target: 25,200–25,400 Patience is key—watch for confirmation at resistance before expecting the next directional move.
@LNChandra3 Nifty will do well in coming months
#Nifty50 Technical Outlook for tomorrow Nifty continues to hold above the key demand zone, indicating that buyers remain active at lower levels. The recent pullback appears to be a potential retail trap, as selling pressure failed to push the index below Support-1. As long as the 23,500–23,600 zone holds, the bullish structure remains intact. A sustained move above the immediate resistance zone around 24,250–24,400 could trigger the next leg higher toward Supply Zone-1 near 25,200–25,350. For now, watch price action around support and resistance closely. The weekly closing will be crucial in confirming whether Nifty is preparing for a breakout or needs more consolidation before the next move. 📈
$OIL $wti $brent we are about to test the monthly demand zone

$OIL $wti $brent may revisit the monthly demand zone and complete the ABC correction if price closes below the marked support and trendline. A breakdown here would add bearish confirmation and open the path toward lower demand levels.

$ETH Technical Analysis (4-Hour Time Frame) ETH/USD is currently trading around $1,673, holding above the key 4-hour support zone between $1,636 and $1,667. Price recently reacted from this demand area, indicating buyers are defending the level. Immediate Support: $1,636 Major Support: $1,561 – $1,545 Immediate Resistance: $1,755 Key Resistance Zone: $1,917 – $1,936 As long as ETH remains above the $1,636 support, the bullish recovery scenario remains valid. A breakout above $1,755 could trigger further upside toward $1,917 and $1,936. However, if price loses the $1,636 support zone, bearish pressure may increase, potentially driving ETH toward the $1,561–$1,545 support area. Bias: Neutral-to-Bullish above $1,636; Bearish below $1,636.


Trevor @Tyrel73236356
103 Followers 764 Following
Crustafarianism @crust_agent
15 Followers 125 Following AI Developer | Building AI Bots for Future Industries 🤖 | Automation • Intelligence • Innovation | The future is coded
Don Danny @DonDanny013
44 Followers 80 Following crypto holder #spaces-host $whale holder $garbage too
MrYang @0xMetaYang
45 Followers 989 Following
keshab chandra tripat... @TripathyKe1966
231 Followers 889 Following

Nebi KARA💤EYBEK @nebi_krzybk
74 Followers 197 Following

Aman Aulakh @_AmanAulakh
37 Followers 98 Following
kaviyaram @kaviya33052425
935 Followers 4K Following 📈 Trader | 10+ Years Experience 🎯 Options & Intraday Trading 📊 Daily Trade Setups & Market Updates 💰 Risk Management Focused 👇 Join Our Trading Community

william wu @williamwu197619
18 Followers 99 Following


✈️AirDrake✈️ @AirdrakeTrades
5K Followers 163 Following Tweets are here just for sheets and giggles.

Ali Hirsi @alihirsi109
11 Followers 156 Following
HeyItsGita @SuryaThase
32 Followers 90 Following
Jamila yusuf @JamilaYusu12324
16 Followers 45 Following
rachi Q @ddabong8989
27 Followers 163 Following


Abu Nazeer @NazeerAbu49605
20 Followers 107 Following
Priyanshu Mishra @PriyanshuM2112
10 Followers 31 Following

rajan gupta @7Rajan8
90 Followers 148 Following
Takiya @teguh3220
96 Followers 2K Following


maczoo @maczoo27073
12 Followers 106 Following
Ufukeray41 @ErayUfuk
15 Followers 18 Following
faldy kaka @FaldyKaka
20 Followers 48 Following
ramachandra @ramacha93129504
99 Followers 1K Following
Patricia @cortez11patrici
501 Followers 4K Following If It Sounds Like A Bad Idea... I'm Probably Already Doing It


Thorfinn @ThorfinnBTC
2K Followers 3K Following i share sweet, happy & heartwarming content from various sources. I may don’t own any content. For credit or removal, please DM us.
vensder @v3n5d3r
363 Followers 5K Following SRE, DevSecOps, Linux, Open Source && Open Heart | Header image by Gregory Maxwell, GFDL 1.2 | https://t.co/xNcjOBrylS


bkman71 @bkman440
193 Followers 836 Following
Tabit Abokhris @TAbokhris91256
375 Followers 3K Following
Trade&HoDL @TradingAndy008
401 Followers 2K Following My trading journal & journey presented as reshares, and the occasional post 🚀 DYOR - Dont copy trade
Le @ler062787
106 Followers 1K Following

Basant Maheshwari @BMTheEquityDesk
323K Followers 206 Following Smallcase: https://t.co/rtMQMaLAe9 For detailed disclaimers, disclosures and other registration details: https://t.co/c6iBE0LYE1

Sei @SeiNetwork
769K Followers 393 Following The Blockchain for Trading • Infrastructure for the modern economy • RT ≠ endorsement • Account managed by @Sei_FND

Cetus🐳 @CetusProtocol
463K Followers 280 Following The leading DEX and liquidity infra on #Sui. #Cetus, where on-chain trading happens. 🌊 🐳
Framia Pro by Converg... @FramiaPro
796 Followers 6 Following All-in-One Creative AI Agents Platform Framia Pro by @ConvergeAI_X Video Agent | Design Agent | Music Agent 20+ Top AI Models in One Subscription
Modified Dow Theory S... @CaptainScio
10K Followers 864 Following Wealth Fund Analysis For Indexes, USD, Oil, BTC, ETH, Silver, Gold, 10 Year Bond I track the real trend, not the noise. I follow back but should be verified.
Extended @extendedapp
30K Followers 50 Following Perp Dex built by ex- @Revolut team. Info only. No advice, offer or solicitation. Eligibility and availability subject to local restrictions.
Entertainers Cricket ... @eclt10league
4K Followers 26 Following Where serious cricket meets fun content! 🎥🏏 India's top cricket league for social media stars!
Sunil Aggarwal @Trustmachines11
59 Followers 133 Following Founder, dropD Network, commitment dating with smart contracts; Author, BITCOIN MAGNET; Ex-Dean, Blockchain Programs, TalentSprint (2018-24)
Sunil Aggarwal @Trustmachines
6K Followers 4K Following Steward-in-Chief, dropD network, dating commitment with smart contracts; Author of BITCOIN MAGNET; Ex-Dean, Blockchain Programs, TalentSprint (2018-24).

1 Billion Followers S... @1billionsummit
9K Followers 2 Following The world’s largest content creator economy summit.
India Blockchain Week... @IBWofficial
9K Followers 14 Following Hosted by @HashedEM, powered by @w2_community
Devcon 8 | Mumbai, In... @EFDevcon
48K Followers 11 Following The flagship event by @ethereumfndn. Devcon 8: Mumbai, India 3-6 Nov 2026.
Bitcoin MENA Conferen... @bitcoinmenaconf
16K Followers 481 Following The biggest #Bitcoin conference in the Middle East 🇦🇪 | Returning December 2026 🔥| Grab your early bird pass 👇
Visual Education @VisEduStudio
155 Followers 41 Following Formerly Karl Taylor Education (@karltaylorphoto) Online Education across the Visual Arts - Lighting, Photography, FIlmmaking, Post-Production, CGI.
Karl Taylor @karltaylorphoto
8K Followers 340 Following For photography and visual arts education follow: @VisEduStudio
CryptoSingh.eth/btc/s... @opinderpreet
8K Followers 3K Following 10+ years in crypto, DeFi is 1st love, Janitor @vannaprotocol, Ex- @chainassets, @aave, @koinfox, @musigmainc , Ex-Blockchain Faculty(ICAI, NPTI )
ETHGlobal @ETHGlobal
107K Followers 2K Following We help builders bring the vision of Ethereum to life. Hosting @ETHConf in NYC, June 2027.

TOKEN2049 @token2049
149K Followers 722 Following #TOKEN2049: The World’s Largest Crypto Event. 🌏 Singapore: 7-8 October 2026 🌍 Dubai: 21-22 April 2027
Pardeep Kumar @whopardeepp
44 Followers 54 FollowingTrends for United States
You might like